domon: 2008年7月アーカイブ
何を思いきや Linux を使ってみたい!
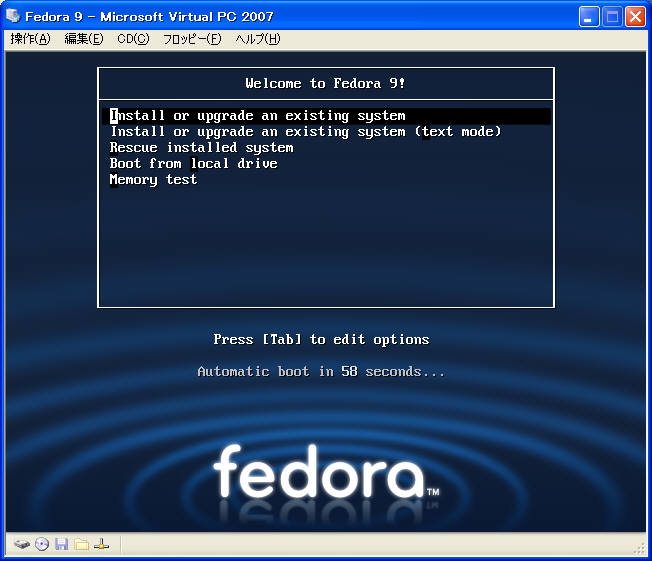
で、手っ取り早い Virtual PC に入れてみる
1.イメージをマウントしOS起動
2.セットアップオプションメニューで<tab>キーを押してオプションを編集
3.起動パラメータに「noreplace-paravirt」追加し<enter>キー
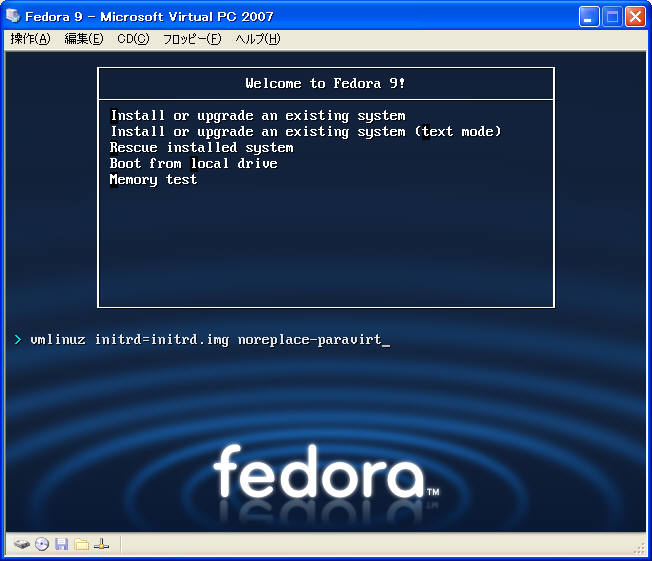

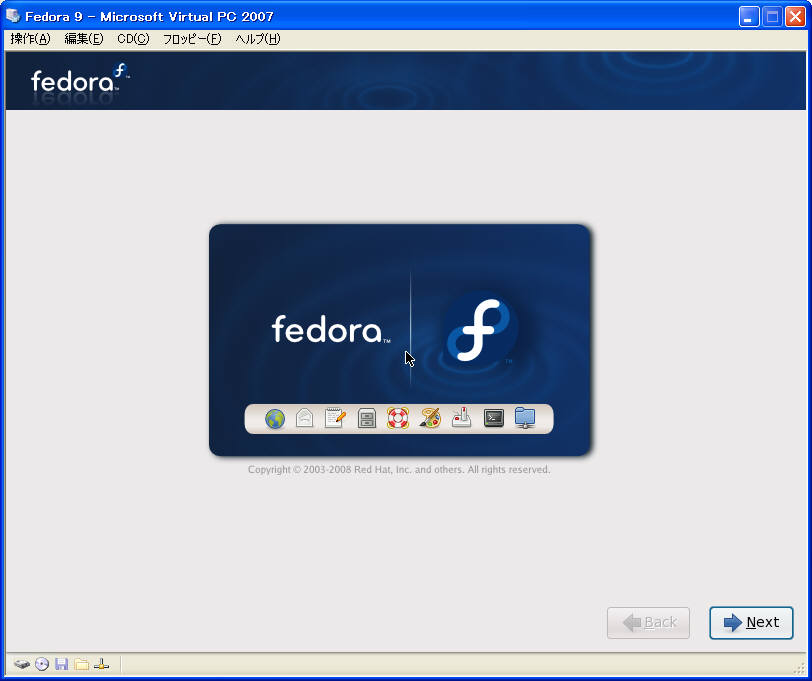
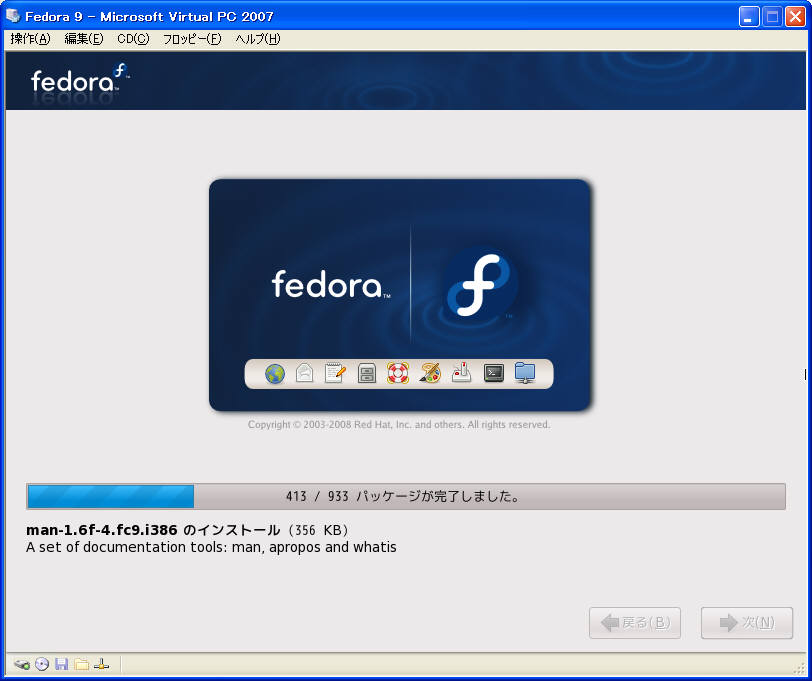
するとイメージが解凍されインストール画面が表示され、<next>ボタンで進みしばらくインストール画面を眺めることに、、、
2 インストール終了後、再起動 起動パラメータkernelに「noreplace-paravirt vesa i8042.noloop psmouse.proto=imps clock=pit noapic nolapic vga=791」を追加。
3 起動した後/boot/grub/menu.lstのkernelに「noreplace-paravirt vesa i8042.noloop psmouse.proto=imps clock=pit noapic nolapic vga=791」を追加。
さぁ、海水浴二日目!
ねぼすけをたたき起して、


朝ごはんを食べ(さすが旅館の朝ごはん)

いざ出撃!


台風が来てるやら天気が怪しいやらで幸先怪しい場まれた海水浴だったが、最高の海水浴日和に恵まれた。
が、いきなり中国道で故障車渋滞17キロ!
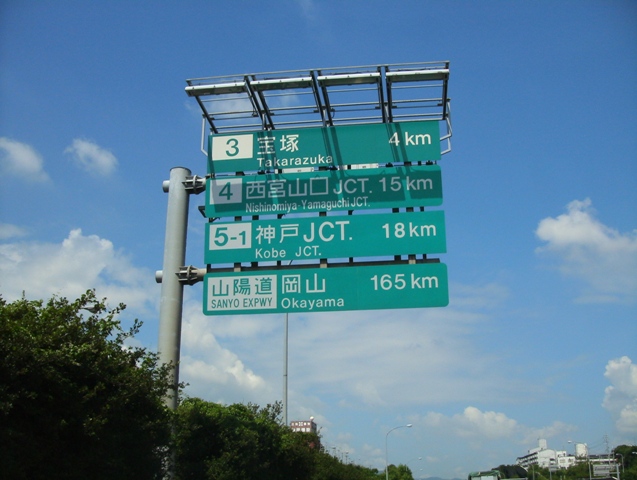
後ろでトイレだ我慢でけへん言うて騒いでる!仕方ないので宝塚で一度降りてマックによって再度高速へ!


スッキリ!マックも食って!到着まで寝るだけ!そうそう寝といてくれ!
渋滞を過ぎると軽快に走りだし予定通り12時頃到着。
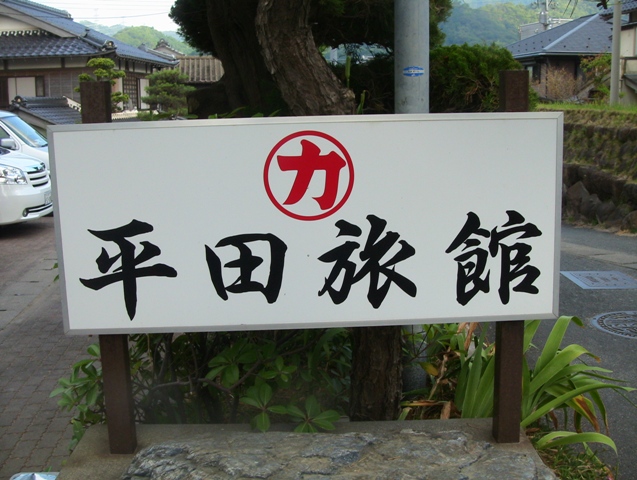
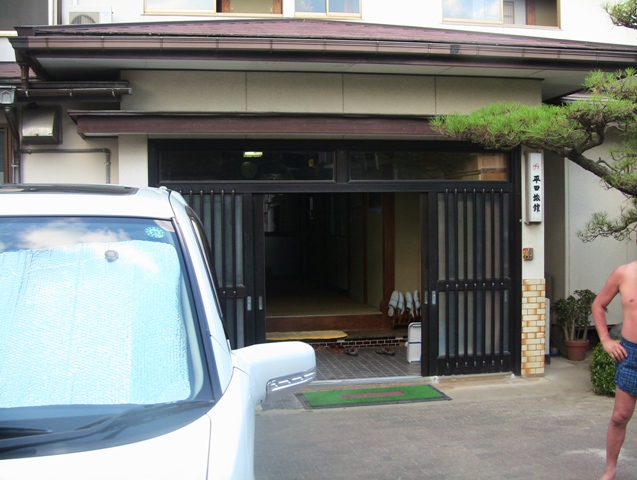
まずは予約していた平田旅館さんにチェックインして
いざ海へ出撃!

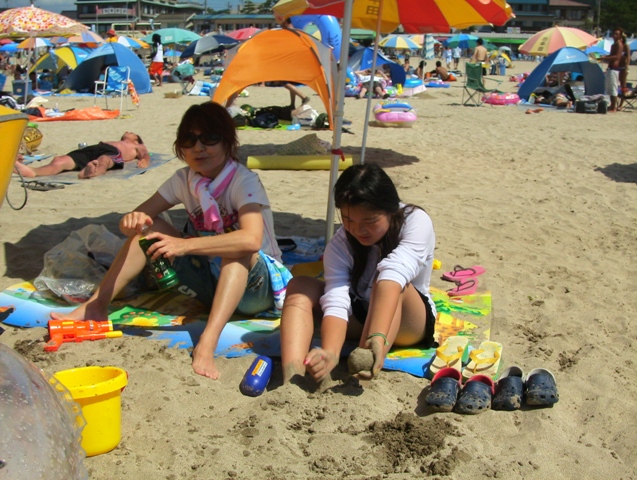
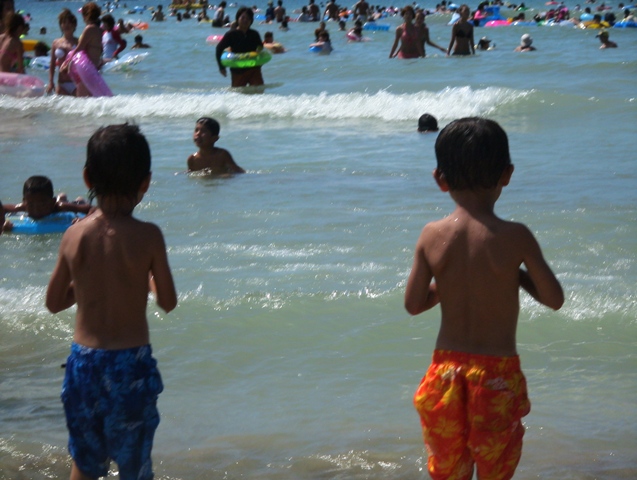

さすが遠浅!ちびっこプールみたい!まぁ、チビらからすれば十分大はしゃぎ!

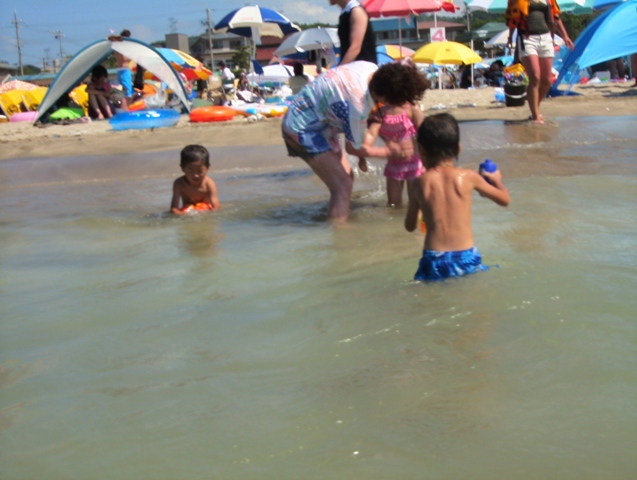


さすがに夕方6時ごろみなさん引き揚げ砂浜にはほとんど人の姿は見えなくなった。

宿に戻って、風呂入って、夕食を済ませすっきりして砂浜で花火をしに行ったら、
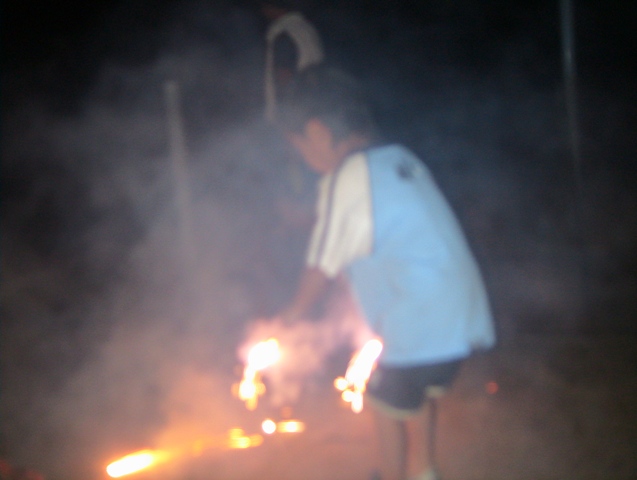
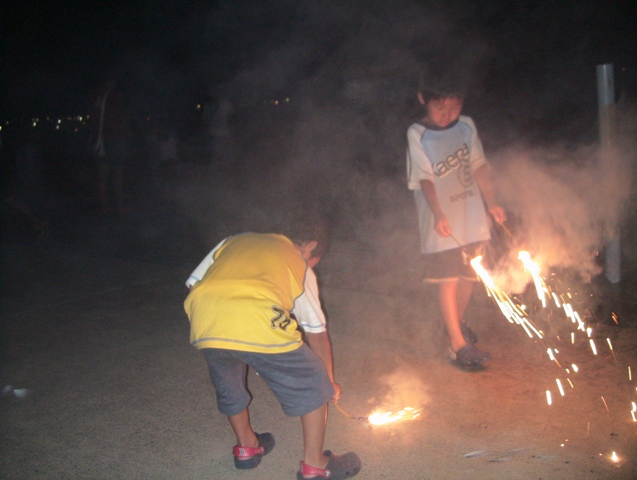
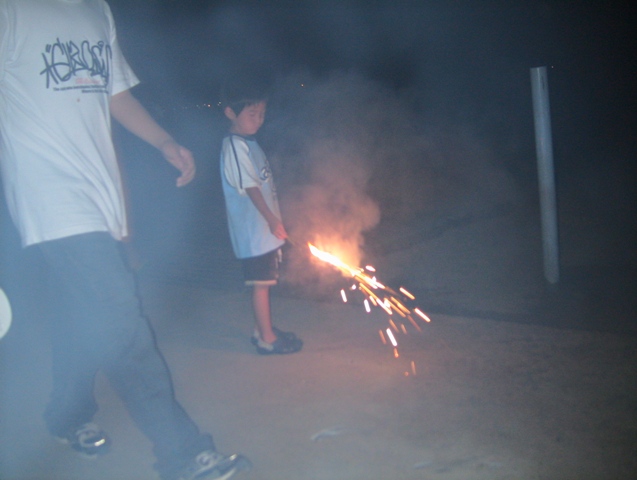
なんてこたぁない、暑いわ!煙にまかれるわ!砂だらけになるわ!
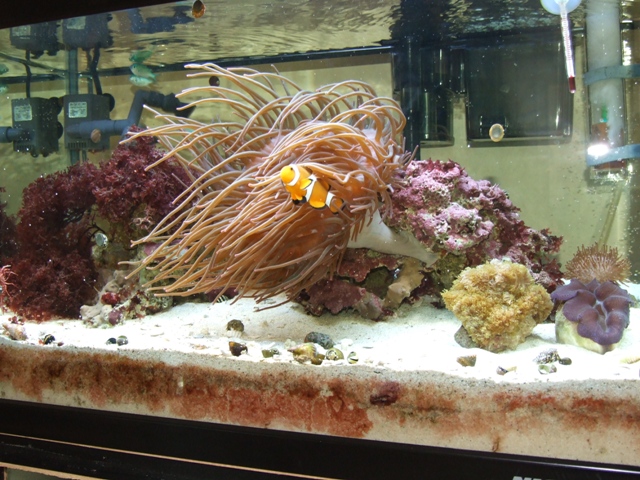
ギャングのヨスジリュキュウスズメダイをショップで引き取ってもらい、デバスズメを5匹追加してみた。
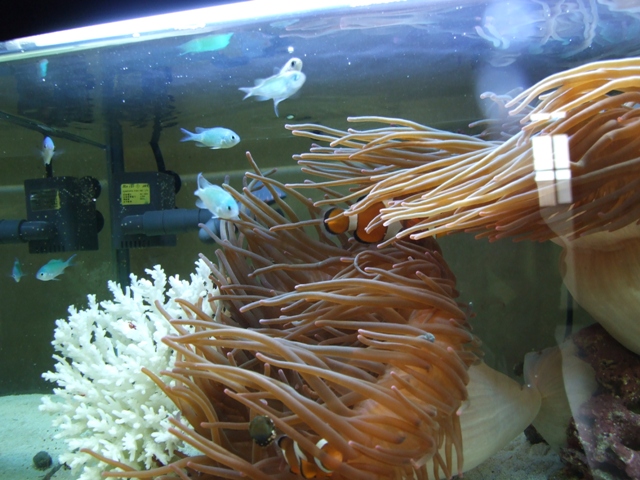

グループ行動が好きなデバスズメ!水槽のにぎわいを奏でてくれてるみたい!
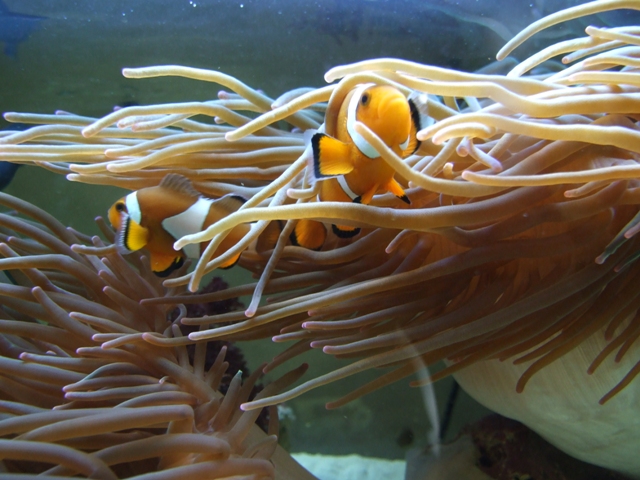
成長を続けるカクレクマノミ!でもデカくなった3年ほどこの水槽で暮らしてる。
ショップで売ってるカクレと見比べるとやはりデい!
とついでに水温上昇対策にファン登場!
GEX製冷却ターボファンコンパクトを使い
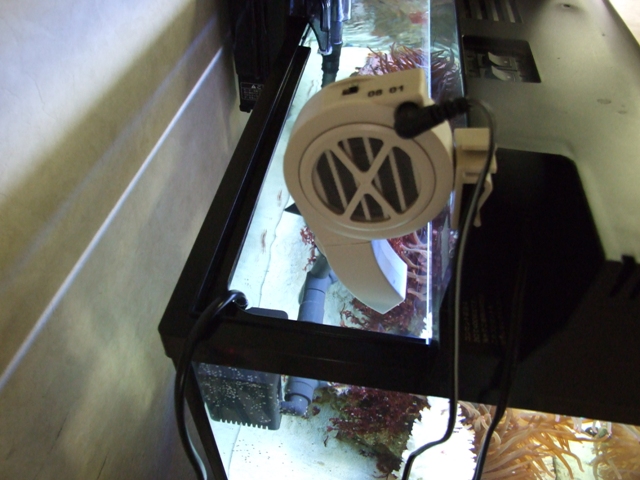
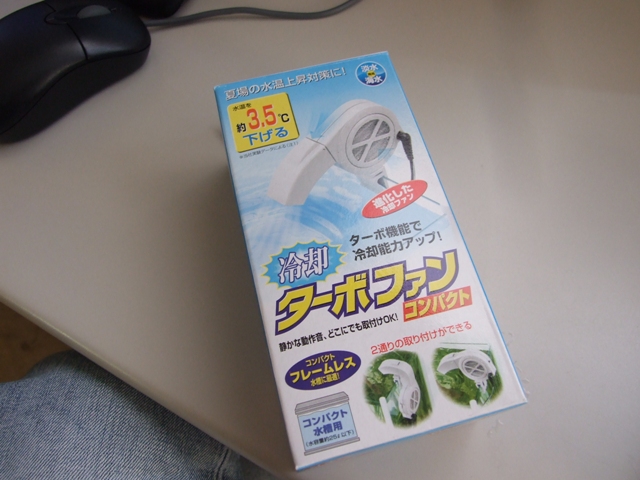
コンパクト設計で収まりはいいのだが、風量はやはりそれなり、、、
水温はというと
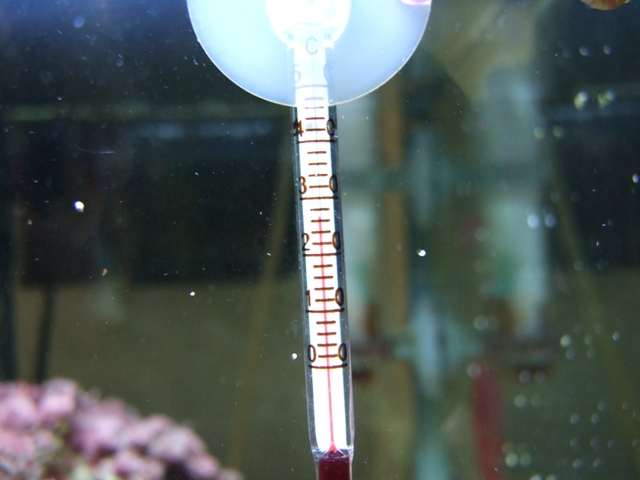
28℃くらい、、、これ以上上昇するともう少し大型のファンに付け替えないといけないかもしれない!
これでも毎日1.5ℓは蒸発するのでしょっちゅう補水は必要です。
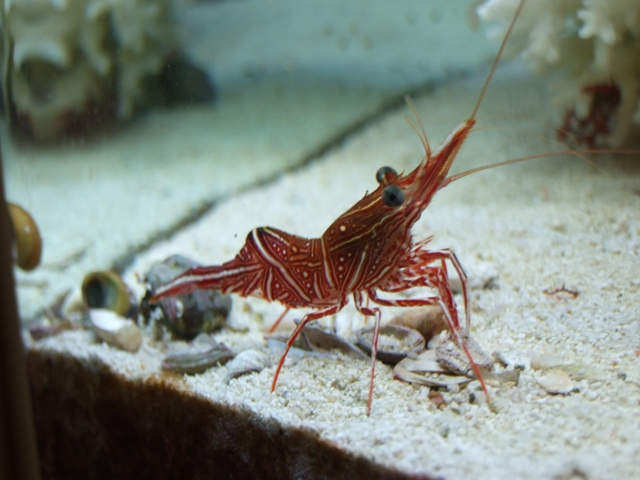
その他の仲間

買いに走った
![]()
を早速使い
全コピーを行った。
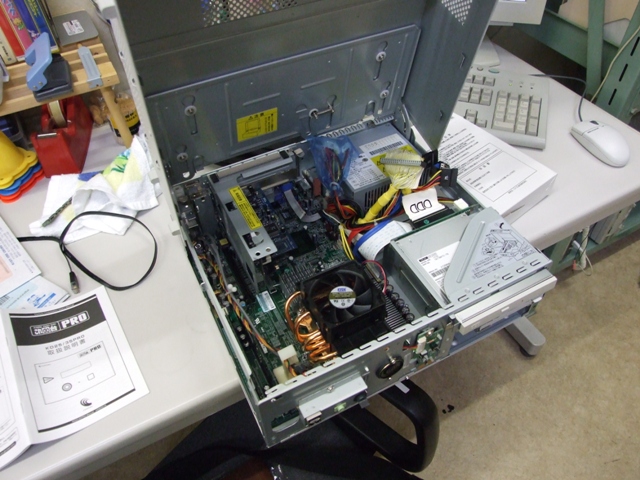
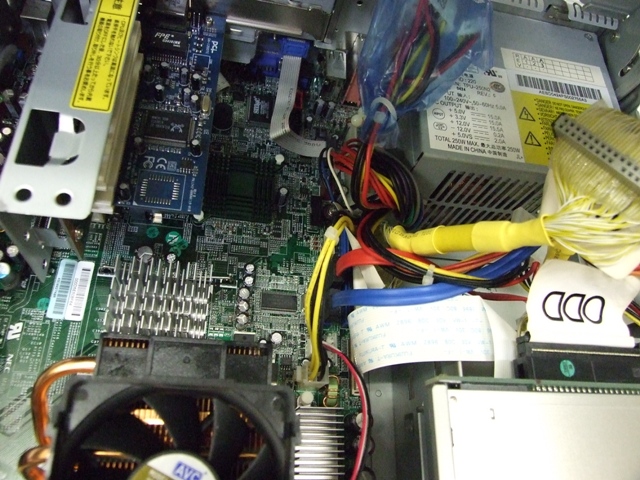
匡体は結構ドライブ類の取り外しは容易に行える構造になっている。
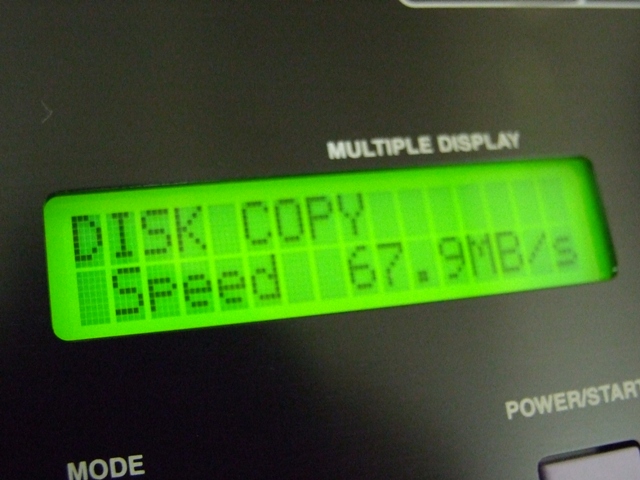
で、DO台はというと旧製品よりかなり良くなっている
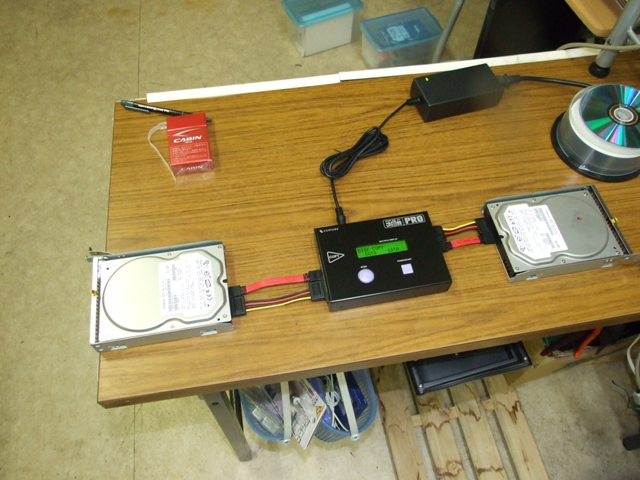
さっそくディスクを接続しコポーモードに切り替えスタート

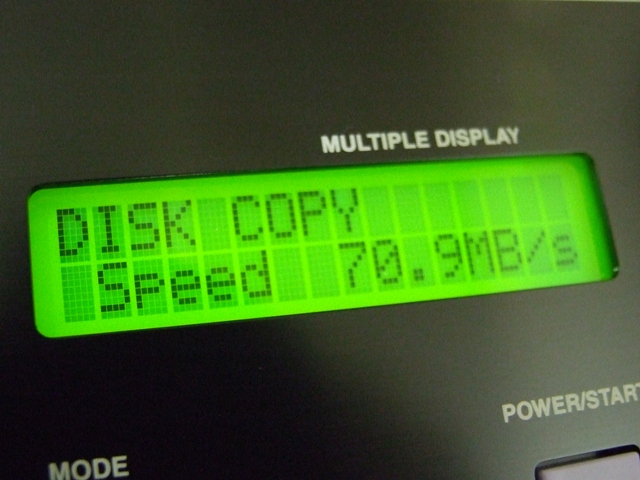


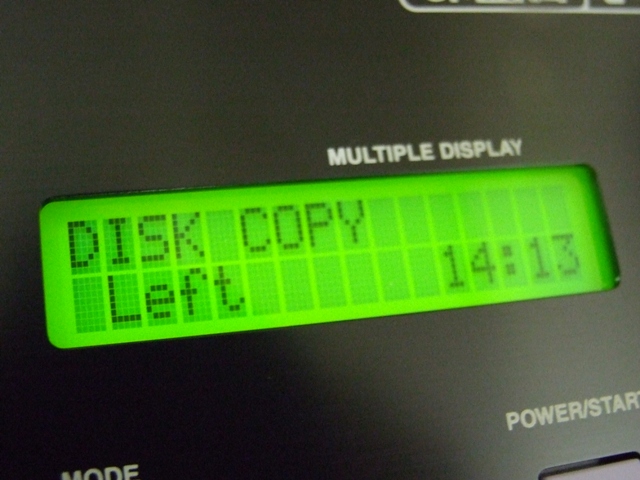
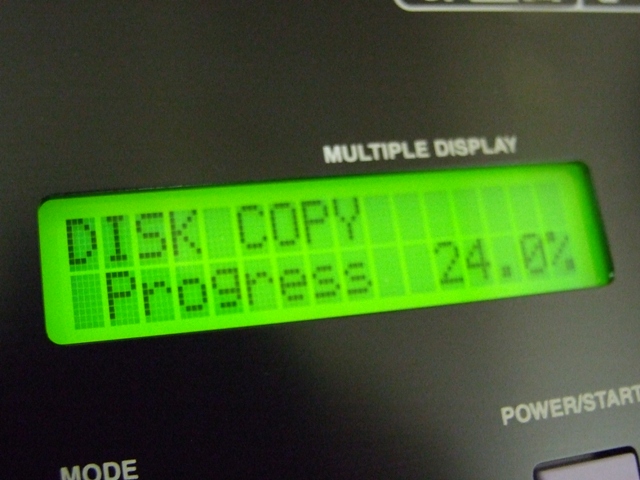

コピー完了したディスクを元に戻しスイッチオン!
無事起動を確認し、
ディスクの状態を確認してみる
[root@sv22 ~]# smartctl -d ata --all /dev/sda
ID# ATTRIBUTE_NAME FLAG VALUE WORST THRESH TYPE UPDATED WHEN_FAILED RAW_VALUE
1 Raw_Read_Error_Rate 0x000b 100 100 016 Pre-fail Always - 0
2 Throughput_Performance 0x0005 100 100 050 Pre-fail Offline - 0
3 Spin_Up_Time 0x0007 100 100 024 Pre-fail Always - 137
4 Start_Stop_Count 0x0012 100 100 000 Old_age Always - 7
5 Reallocated_Sector_Ct 0x0033 100 100 005 Pre-fail Always - 0
7 Seek_Error_Rate 0x000b 100 100 067 Pre-fail Always - 0
8 Seek_Time_Performance 0x0005 100 100 020 Pre-fail Offline - 0
9 Power_On_Hours 0x0012 100 100 000 Old_age Always - 6
10 Spin_Retry_Count 0x0013 100 100 060 Pre-fail Always - 0
12 Power_Cycle_Count 0x0032 100 100 000 Old_age Always - 7
192 Power-Off_Retract_Count 0x0032 100 100 000 Old_age Always - 7
193 Load_Cycle_Count 0x0012 100 100 000 Old_age Always - 7
194 Temperature_Celsius 0x0002 127 127 000 Old_age Always - 47 (Lifetime Min/Max 25/55)
196 Reallocated_Event_Count 0x0032 100 100 000 Old_age Always - 0
197 Current_Pending_Sector 0x0022 100 100 000 Old_age Always - 0
198 Offline_Uncorrectable 0x0008 100 100 000 Old_age Offline - 0
199 UDMA_CRC_Error_Count 0x000a 200 253 000 Old_age Always - 0
を見てみるとエラーの兆候は見られない。
これで先ずは一安心?
しかし一度のディスクコピー他のために3万円かかってしまった、、、とほほ!
[root@sv22 ~]# smartctl -d ata --all /dev/sda
smartctl version 5.36 [i686-redhat-linux-gnu] Copyright (C) 2002-6 Bruce Allen
Home page is http://smartmontools.sourceforge.net/
=== START OF INFORMATION SECTION ===
Device Model: Hitachi HDS721680PLA380
Serial Number: PVF804Z31HLUWN
Firmware Version: P21OABEA
User Capacity: 80,026,361,856 bytes
Device is: Not in smartctl database [for details use: -P showall]
ATA Version is: 7
ATA Standard is: ATA/ATAPI-7 T13 1532D revision 1
Local Time is: Wed Jul 9 14:16:31 2008 JST
SMART support is: Available - device has SMART capability.
SMART support is: Enabled
=== START OF READ SMART DATA SECTION ===
SMART overall-health self-assessment test result: PASSED
General SMART Values:
Offline data collection status: (0x04) Offline data collection activity
was suspended by an interrupting command from host.
Auto Offline Data Collection: Disabled.
Self-test execution status: ( 25) The self-test routine was aborted by
the host.
Total time to complete Offline
data collection: (1445) seconds.
Offline data collection
capabilities: (0x5b) SMART execute Offline immediate.
Auto Offline data collection on/off support.
Suspend Offline collection upon new
command.
Offline surface scan supported.
Self-test supported.
No Conveyance Self-test supported.
Selective Self-test supported.
SMART capabilities: (0x0003) Saves SMART data before entering
power-saving mode.
Supports SMART auto save timer.
Error logging capability: (0x01) Error logging supported.
General Purpose Logging supported.
Short self-test routine
recommended polling time: ( 1) minutes.
Extended self-test routine
recommended polling time: ( 24) minutes.
SMART Attributes Data Structure revision number: 16
Vendor Specific SMART Attributes with Thresholds:
ID# ATTRIBUTE_NAME FLAG VALUE WORST THRESH TYPE UPDATED WHEN_FAILED RAW_VALUE
1 Raw_Read_Error_Rate 0x000b 088 088 016 Pre-fail Always - 852037
2 Throughput_Performance 0x0005 100 100 050 Pre-fail Offline - 0
3 Spin_Up_Time 0x0007 136 136 024 Pre-fail Always - 160 (Average 134)
4 Start_Stop_Count 0x0012 100 100 000 Old_age Always - 11
5 Reallocated_Sector_Ct 0x0033 100 100 005 Pre-fail Always - 16
7 Seek_Error_Rate 0x000b 100 100 067 Pre-fail Always - 0
8 Seek_Time_Performance 0x0005 100 100 020 Pre-fail Offline - 0
9 Power_On_Hours 0x0012 100 100 000 Old_age Always - 866
10 Spin_Retry_Count 0x0013 100 100 060 Pre-fail Always - 0
12 Power_Cycle_Count 0x0032 100 100 000 Old_age Always - 11
192 Power-Off_Retract_Count 0x0032 100 100 000 Old_age Always - 47
193 Load_Cycle_Count 0x0012 100 100 000 Old_age Always - 47
194 Temperature_Celsius 0x0002 111 111 000 Old_age Always - 54 (Lifetime Min/Max 24/62)
196 Reallocated_Event_Count 0x0032 100 100 000 Old_age Always - 19
197 Current_Pending_Sector 0x0022 100 100 000 Old_age Always - 1
198 Offline_Uncorrectable 0x0008 100 100 000 Old_age Offline - 0
199 UDMA_CRC_Error_Count 0x000a 200 253 000 Old_age Always - 0
SMART Error Log Version: 1
ATA Error Count: 6 (device log contains only the most recent five errors)
CR = Command Register [HEX]
FR = Features Register [HEX]
SC = Sector Count Register [HEX]
SN = Sector Number Register [HEX]
CL = Cylinder Low Register [HEX]
CH = Cylinder High Register [HEX]
DH = Device/Head Register [HEX]
DC = Device Command Register [HEX]
ER = Error register [HEX]
ST = Status register [HEX]
Powered_Up_Time is measured from power on, and printed as
DDd+hh:mm:SS.sss where DD=days, hh=hours, mm=minutes,
SS=sec, and sss=millisec. It "wraps" after 49.710 days.
Error 6 occurred at disk power-on lifetime: 787 hours (32 days + 19 hours)
When the command that caused the error occurred, the device was active or idle.
After command completion occurred, registers were:
ER ST SC SN CL CH DH
-- -- -- -- -- -- --
40 51 08 4d b4 07 e0 Error: UNC 8 sectors at LBA = 0x0007b44d = 504909
Commands leading to the command that caused the error were:
CR FR SC SN CL CH DH DC Powered_Up_Time Command/Feature_Name
-- -- -- -- -- -- -- -- ---------------- --------------------
c8 00 20 35 b4 07 e0 08 24d+11:12:32.500 READ DMA
c8 00 08 d5 ba 07 e0 08 24d+11:12:32.400 READ DMA
c8 00 18 45 bb 07 e0 08 24d+11:12:32.200 READ DMA
c8 00 20 1d bb 07 e0 08 24d+11:12:32.200 READ DMA
c8 00 08 15 bb 07 e0 08 24d+11:12:32.200 READ DMA
Error 5 occurred at disk power-on lifetime: 612 hours (25 days + 12 hours)
When the command that caused the error occurred, the device was active or idle.
After command completion occurred, registers were:
ER ST SC SN CL CH DH
-- -- -- -- -- -- --
40 51 44 09 36 03 e0 Error: UNC 68 sectors at LBA = 0x00033609 = 210441
Commands leading to the command that caused the error were:
CR FR SC SN CL CH DH DC Powered_Up_Time Command/Feature_Name
-- -- -- -- -- -- -- -- ---------------- --------------------
c8 00 e0 6d 35 03 e0 08 17d+05:05:53.700 READ DMA
27 00 00 00 00 00 e0 08 17d+05:05:53.700 READ NATIVE MAX ADDRESS EXT
ec 00 00 00 00 00 a0 0a 17d+05:05:53.700 IDENTIFY DEVICE
ef 03 46 00 00 00 a0 0a 17d+05:05:53.700 SET FEATURES [Set transfer mode]
27 00 00 00 00 00 e0 08 17d+05:05:53.700 READ NATIVE MAX ADDRESS EXT
Error 4 occurred at disk power-on lifetime: 612 hours (25 days + 12 hours)
When the command that caused the error occurred, the device was active or idle.
After command completion occurred, registers were:
ER ST SC SN CL CH DH
-- -- -- -- -- -- --
40 51 44 09 36 03 e0 Error: UNC 68 sectors at LBA = 0x00033609 = 210441
Commands leading to the command that caused the error were:
CR FR SC SN CL CH DH DC Powered_Up_Time Command/Feature_Name
-- -- -- -- -- -- -- -- ---------------- --------------------
c8 00 e0 6d 35 03 e0 08 17d+05:05:49.000 READ DMA
27 00 00 00 00 00 e0 08 17d+05:05:49.000 READ NATIVE MAX ADDRESS EXT
ec 00 00 00 00 00 a0 0a 17d+05:05:49.000 IDENTIFY DEVICE
ef 03 46 00 00 00 a0 0a 17d+05:05:49.000 SET FEATURES [Set transfer mode]
27 00 00 00 00 00 e0 08 17d+05:05:49.000 READ NATIVE MAX ADDRESS EXT
Error 3 occurred at disk power-on lifetime: 612 hours (25 days + 12 hours)
When the command that caused the error occurred, the device was active or idle.
After command completion occurred, registers were:
ER ST SC SN CL CH DH
-- -- -- -- -- -- --
40 51 44 09 36 03 e0 Error: UNC 68 sectors at LBA = 0x00033609 = 210441
Commands leading to the command that caused the error were:
CR FR SC SN CL CH DH DC Powered_Up_Time Command/Feature_Name
-- -- -- -- -- -- -- -- ---------------- --------------------
c8 00 e0 6d 35 03 e0 08 17d+05:05:44.300 READ DMA
27 00 00 00 00 00 e0 08 17d+05:05:44.300 READ NATIVE MAX ADDRESS EXT
ec 00 00 00 00 00 a0 0a 17d+05:05:44.300 IDENTIFY DEVICE
ef 03 46 00 00 00 a0 0a 17d+05:05:44.300 SET FEATURES [Set transfer mode]
27 00 00 00 00 00 e0 08 17d+05:05:44.300 READ NATIVE MAX ADDRESS EXT
Error 2 occurred at disk power-on lifetime: 612 hours (25 days + 12 hours)
When the command that caused the error occurred, the device was active or idle.
After command completion occurred, registers were:
ER ST SC SN CL CH DH
-- -- -- -- -- -- --
40 51 44 09 36 03 e0 Error: UNC 68 sectors at LBA = 0x00033609 = 210441
Commands leading to the command that caused the error were:
CR FR SC SN CL CH DH DC Powered_Up_Time Command/Feature_Name
-- -- -- -- -- -- -- -- ---------------- --------------------
c8 00 e0 6d 35 03 e0 08 17d+05:05:39.600 READ DMA
27 00 00 00 00 00 e0 08 17d+05:05:39.600 READ NATIVE MAX ADDRESS EXT
ec 00 00 00 00 00 a0 0a 17d+05:05:39.600 IDENTIFY DEVICE
ef 03 46 00 00 00 a0 0a 17d+05:05:39.600 SET FEATURES [Set transfer mode]
27 00 00 00 00 00 e0 08 17d+05:05:39.600 READ NATIVE MAX ADDRESS EXT
SMART Self-test log structure revision number 1
Num Test_Description Status Remaining LifeTime(hours) LBA_of_first_error
# 1 Extended offline Aborted by host 90% 866 -
# 2 Short offline Completed without error 00% 866 -
SMART Selective self-test log data structure revision number 1
SPAN MIN_LBA MAX_LBA CURRENT_TEST_STATUS
1 0 0 Not_testing
2 0 0 Not_testing
3 0 0 Not_testing
4 0 0 Not_testing
5 0 0 Not_testing
Selective self-test flags (0x0):
After scanning selected spans, do NOT read-scan remainder of disk.
If Selective self-test is pending on power-up, resume after 0 minute delay.
うぅ~詳しくはわからないがエラーが6つ見つかり、太字の部分が要注意らしい
01 Raw Read Error Rate この項目はハードディスクからデータを読み込む時に発生したエラーの割合を表す。数値が閾値より低い場合、ハードディスク内の磁気ディスクまたは磁気ヘッドに異常がある。
05 Reallocated Sectors Count 代替処置(データを特別に予約した予備エリアに移動する)を施された不良セクタの数。
C4(196) Reallocation Event Count セクタの代替処理が発生した回数。仮に処理に失敗しても回数に加算される。
C5(197) Current Pending Sector Count 現在異常があり、代替処理を待つセクタの総数。もし後で読み込みに成功したセクタがあれば、この値は減少する。
C6(198) Off-Line Scan Uncorrectable Sector Count オフラインスキャン時に発見された、回復不可能なセクタの総数。この値が増加する場合は、磁気ディスクの表面に明確な問題がある。
ので、ディスクを交換することに!
しかしディスクの内容は丸ごとコピーしたいので、色々パーティションツールを試したがうまいこといかないので、センチュリー製のこれDO台 PRO を買いに走った!
![]()
高っけぇ~26,800円
ひと月ほど前に仕替えたLinux (CentOS Linux 5)が機嫌よく動いていたにもかかわらず、なにやらエラーを吐いているのに気がついた。
ログを見てみると
Jul 9 11:38:07 sv22 smartd[3142]: smartd version 5.36 [i686-redhat-linux-gnu] Copyright (C) 2002-6 Bruce Allen
Jul 9 11:38:07 sv22 smartd[3142]: Home page is http://smartmontools.sourceforge.net/
Jul 9 11:38:07 sv22 smartd[3142]: Opened configuration file /etc/smartd.conf
Jul 9 11:38:07 sv22 smartd[3142]: Configuration file /etc/smartd.conf parsed.
Jul 9 11:38:07 sv22 smartd[3142]: Device: /dev/sda, opened
Jul 9 11:38:07 sv22 smartd[3142]: Device: /dev/sda, not found in smartd database.
Jul 9 11:38:08 sv22 smartd[3142]: Device: /dev/sda, is SMART capable. Adding to "monitor" list.
Jul 9 11:38:08 sv22 smartd[3142]: Monitoring 1 ATA and 0 SCSI devices
Jul 9 11:38:08 sv22 smartd[3142]: Device: /dev/sda, 1 Currently unreadable (pending) sectors
Jul 9 11:38:08 sv22 smartd[3142]: Sending warning via mail to root ...
Jul 9 11:38:08 sv22 smartd[3142]: Warning via mail to root: successful
Jul 9 11:38:08 sv22 smartd[3148]: smartd has fork()ed into background mode. New PID=3148.
うぅ~、ようわからん!英和辞典片手によぉ~く見てみる!
smartdがエラーを吐いているみたい、、、
SMARTってS.M.A.R.T.(スマート:Self-Monitoring, Analysis and Reporting Technology System)は、多くのハードディスクが持っている自己診断機能だ。S.M.A.R.T.から得られる情報を監視することによって、ハードディスクの故障を未然に防げる可能性もある。
とりあえず、
■ /etc/smartd.conf の編集
[root@sv22 ~]# vi /etc/smartd.conf
/dev/sda -d ata -H -m root
↓
/dev/sda2 -d ata -H -m root
■ smartd 再起動
[root@sv22 ~]# /etc/rc.d/init.d/smartd restart
smartd を停止中: [ OK ]
smartd を起動中: [ OK ]
ア・カ・ン!かわらない!
/etc/smartd.conf の /dev/sda -d ata -H -m root が元に戻っている。
あぁ~、/etc/smartd.conf の編集は man smartd.conf を使うらしい!ので、早速
[root@sv22 ~]# man smartd.conf
なんか出てきた!
???
とりあえず、わからないので
■ smartd 自動起動停止
[root@sv22 ~]# chkconfig smartd off
[root@sv22 ~]# chkconfig --list smartd
smartd 0:off 1:off 2:off 3:off 4:off 5:off 6:off
Movable TypeでLightbox JSが動くようになったが、Movable Typeで画像を挿入すると
このようなタグが生成され、さらに rel="lightbox" を付加しないといけないので
<a href="元画像">
↓
<a href="元画像" rel="lightbox">
Movable Typeで画像挿入自に自動で rel="lightbox" を付加してくれる「LightBox2MT」というプラグインを組み込んでみる。
まずはLightBox2MTを入手
LightBox2MT.zip
解凍したLightBox2MTフォルダをmt-staticディレクトリ内のpluginsにアップロードする。
さっそく試してみた!
あかん!うまいこといかない!
Lightbox.jsは、サムネイルをクリックすると、元の大きさのイメージを同じウィンドウに表示してくれるJAVAスクリプトで、ポップアップでもなく別ウィンドウでもなくなかなかええ感なので
まぁ、今の流行りということで試してみる。
 ← クリックしてみ!
まずはLightbox.js v2.0を入手
http://www.huddletogether.com/projects/lightbox2/ からLightbox.jsをダウンロードし展開
■ js/lightbox.js の編集
49行目 fileLoadingImage: 'images/loading.gif',
50行目 fileBottomNavCloseImage: 'images/closelabel.gif',
↓
49行目 fileLoadingImage: 'http://www.domainname.com/lightbox/loading.gif',
50行目 fileBottomNavCloseImage: 'http://www.domainname.com/lightbox/closelabel.gif',
バーチャルドメインを使っているのでどのドメインからも1つの Lightbox.js v2.0 を使いまわせるように絶対パスで記述してみます
■ lightbox の配置
/virtual/domainname.com/lightbox へ配置
lightbox
├─css
│ └─lightbox.css
├─images
│ ├─bullet.gif
│ ├─close.gif
│ ├─closelabel.gif
│ ├─donate-button.gif
│ ├─download-icon.gif
│ ├─image-1.jpg
│ ├─loading.gif
│ ├─nextlabel.gif
│ ├─prevlabel.gif
│ ├─thumb-1.jpg
│ └─Thumbs.db
├─index.html
└─js
├─builder.js
├─effects.js
├─lightbox.js
├─prototype.js
└─scriptaculous.js
■ /etc/httpd/conf/vhost.conf にエイリアスの追加
[root@sv22 ~]# vi /etc/httpd/conf/vhost.conf
Alias /lightbox/ "/virtual/domon.jp/lightbox/"
を追加
■ Apache の再起動
[root@sv22 ~]# /etc/rc.d/init.d/httpd restart
httpd を停止中: [ OK ]
httpd を起動中: [ OK ]
■ Movable Type - スタイルシート の設定
<デザイン>→<テンプレート>→<スタイルシート(メイン)(styles.css)>に
@import url(http://www.domainname.com/lightbox/css/lightbox.css) screen;
を追加
<デザイン>→<テンプレート>→<メインページ(index.html)>に
<script src="http://www.domainname.com/lightbox/js/prototype.js" type="text/javascript">
<script src="http://www.domainname.com/lightbox/js/scriptaculous.js?load=effects,builder" type="text/javascript">
<script src="http://www.domainname.com/lightbox/js/lightbox.js" type="text/javascript">
を追加
追加したら保存して再構築します。
以上で一通りLightbox JSの準備ができました。
Lightbox JSでサムネイル画像を表示させるには、以下のようにします。

のように aリンクの最後に rel="lightbox" を追加
おっ!でけた!
================================================================================
【 作者名 】 Naoya Shimada
【モジュール名】 OpenPNE 改造なしにコメント欄にメンバーの写真を表示する
【 バージョン 】 Ver 0.3.0
【 作成日 】 2008/06/14
【 開発言語 】 PHP
【 ライセンス 】 The PHP License, version 3.01
【 著作権者 】 Naoya Shimada / しまさん
【 再配布 】 可
【 転載 】 可
【ホームページ】 http://shima3.seesaa.net/
【 連絡先 】 shima3amihs@gmail.com
================================================================================
を試させてもらうことにしました。
オープンソースのショッピングサイトシステムのEC-CUBE‐日本発の「ECオープンソース」をインストールしてふにゃふにゃ捜査していると中で管理画面の中にある【売上集計】の<月度で集計する>を実行すると画面が真っ白になる。
ありぃ~
エラーログを見ると
PHP Fatal error: Maximum execution time of 30 seconds exceeded in
何やらPHPがエラーを吐いている!
ので
■ /etc/php.ini の編集
[root@sv22 ~]# vi /etc/php.ini
max_execution_time = 30
↓
max_execution_time = 60
max_input_time = 60
↓
max_input_time = 90
memory_limit = 16M
↓
memory_limit = 64M
として
■ apache の再起動
[root@sv22 ~]# /etc/rc.d/init.d/httpd restart
としてみたが、
PHP Fatal error: Maximum execution time of 60 seconds exceeded in
まだあかん!
で、もう一度
[root@sv22 ~]# vi /etc/php.ini
max_execution_time = 30
↓
max_execution_time = 60
↓
max_execution_time = 90
max_input_time = 60
↓
max_input_time = 90
↓
max_input_time = 120
memory_limit = 16M
↓
memory_limit = 64M
■ apache の再起動
[root@sv22 ~]# /etc/rc.d/init.d/httpd restart
としてみら、おっ!でけた!
確かに日ごとの集計を一覧表示に知る大変な作業見たいです。
今使っているルーターがプラネックス コミュニケーションズの【BLW-04FMG】を使っている
このルーターにはsyslog機能があるためルーターのログをLinuxにためてみることにしました。
■ ログファイルの作成
[root@sv22 ~]# touch /var/log/router
■ /etc/syslog.conf の編集
[root@sv22 ~]# vi /etc/syslog.conf
user.debug;user.notice;user.info /var/log/router ← 最後に一行追加(infoと/varの間はtabに注意)
■ /etc/rc.d/init.d/syslog の編集
[root@sv22 ~]# vi /etc/rc.d/init.d/syslog
daemon syslogd $SYSLOGD_OPTIONS
↓
daemon syslogd -r $SYSLOGD_OPTIONS ← "-r"を追加
■ /etc/logrotate.d/syslog の編集
[root@sv22 ~]# vi /etc/logrotate.d/syslog
/var/log/messages /var/log/secure /var/log/spooler /var/log/boot.log /var/log/cron
↓
/var/log/messages /var/log/secure /var/log/spooler /var/log/boot.log /var/log/cron /var/log/router
■ sysylog の再起動
[root@sv22 ~]# # /etc/rc.d/init.d/syslog restart
■ ルーターの設定変更
<メンテナンス>→<ログ>と進み
ログ方法 syslog、WWW設定画面を有効に
syslogレベル notice、infoを有効に
syslogサーバIPアドレス ... を指定
<設定>
で、しばらく不正アクセスを待ってみる
うわぁ~きたぁ~
Jul 1 12:28:07 192.168.10.254 blw04fmg UDP packet dropped - Source:161.253.13.64,80,WAN - Destination:221.113.56.5,27355,LAN
Jul 1 12:28:07 192.168.10.254 blw04fmg [2008-07-01 12:28:07] | From:[161.253.13.64] | Port:[27355] | [Blocked]
Jul 1 12:28:10 192.168.10.254 blw04fmg UDP packet dropped - Source:75.74.230.225,43250,WAN - Destination:221.113.56.5,27355,LAN
Jul 1 12:28:10 192.168.10.254 blw04fmg [2008-07-01 12:28:10] | From:[75.74.230.225] | Port:[27355] | [Blocked]
Jul 1 12:28:18 192.168.10.254 blw04fmg UDP packet dropped - Source:75.142.209.119,1260,WAN - Destination:221.113.56.5,27355,LAN
Jul 1 12:28:18 192.168.10.254 blw04fmg [2008-07-01 12:28:18] | From:[75.142.209.119] | Port:[27355] | [Blocked]
Jul 1 12:28:22 192.168.10.254 blw04fmg UDP packet dropped - Source:190.52.156.245,10256,WAN - Destination:221.113.56.5,27355,LAN
Jul 1 12:28:22 192.168.10.254 blw04fmg [2008-07-01 12:28:22] | From:[190.52.156.245] | Port:[27355] | [Blocked]
Jul 1 12:28:22 192.168.10.254 blw04fmg UDP packet dropped - Source:222.187.196.134,9285,WAN - Destination:221.113.56.5,27355,LAN
Jul 1 12:28:22 192.168.10.254 blw04fmg [2008-07-01 12:28:22] | From:[222.187.196.134] | Port:[27355] | [Blocked]
Jul 1 12:28:23 192.168.10.254 blw04fmg UDP packet dropped - Source:219.73.64.155,10414,WAN - Destination:221.113.56.5,27355,LAN
Jul 1 12:28:23 192.168.10.254 blw04fmg [2008-07-01 12:28:23] | From:[219.73.64.155] | Port:[27355] | [Blocked]
Jul 1 12:28:44 192.168.10.254 blw04fmg UDP packet dropped - Source:68.249.106.150,49955,WAN - Destination:221.113.56.5,27355,LAN
Jul 1 12:28:44 192.168.10.254 blw04fmg [2008-07-01 12:28:44] | From:[68.249.106.150] | Port:[27355] | [Blocked]
設定してから半日でログファイルは2メガを超えている!
